...
- Select
 General >
 Dashboards.The Dashboards menu is expanded:
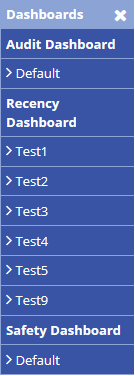
- Select an available Safety Dashboard item (we will select Default in this instance). The Safety Dashboard screen for the selected default dashboard is displayed:

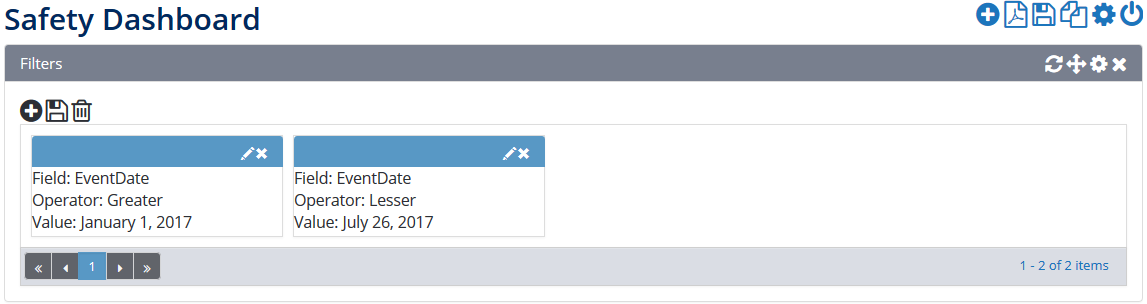
Scroll to the Filters pane and modify the required filters. Alternatively, scroll to the required widget (i.e. graph or chart).
Left-click on the required set of data. All the widgets on the dashboard automatically adjust to filter the data based on the selected data.
 For example, if you select the Low Risk section from the Safety Reports by Risk graph all the other graphs and charts will automatically update to filter their data against Low Risk safety reports. All filters applied to a dashboard can be found in the Filters pane located at the top of the dashboard.
...